December 25, 2009

Day 25 - Introducing UNIX 4.0!

I know. Advent is only 24 days. Continuing from last year's "Jordan had no idea advent was only 24 days" tradition, here is a bonus 25th article to wrap up this year's sysadvent. Enjoy! :)

I have these two nearly-30-year old computer manuals that were given to me by a coworker who thought I'd be interested. Boy was I! I'm that kind of nerd. Anyway, these books were internal Bell Labs manuals/guides for helping folks do stuff on UNIX. They were printed before I was born and contain great content for interviews because they document UNIX shell, editor, system programming, and other pieces that are still here, today. You'll find few of the topics covered have changed since UNIX, 30 years ago; FreeBSD, Linux, and Solaris all have fairly clear heritage here.

Welcome to UNIX Release 4.0!

The books themselves contain multiple sections covering a range of topics. With respect to the UNIX version covered, the intro says it is relevant to UNIX 4 (1974), but I think most of it is relevant UNIX version 7 (1979) which was released nearer to the print dates in these books.

The intro to the book, which discusses notation and conventions, explains this:

Entries in Section n of the UNIX User's Manual are referred to by name(n).
I always did think that the name(n) notation for manpages was useful, and now I have a better understanding of how old this stuff really is.

One of these books is "UNIX Programming Starter Package." It includes "UNIX Shell Tutorial" by G. A. Snyder and J. R. Mashey. The copy I have is dated January 1981. It starts with talking about the filesystem. "If a path name begins with a /, the search for the file begins at the root of the entire tree; otherwise, it begins at the user's current directory." It goes on to discuss absolute vs relative path nomenclature.

Next, it discusses processes: how a fork of will spawn an identical copy of the original process, that both can continue to execute in parallel, and that either may call exec(2) to abandon the current program and start a new one. It also talks about wait(2) and how the parent might use it, and includes a diagram of it:

Continuing the process discussion, this tutorial explains that child processes inherit open files and signals. You'll learn about process termination, including the 8-bit exit status value and about success (zero) and failure (non-zero). Signals are also explained: a signal may come from "another process, from the terminal, or by UNIX itself." Signals can be ignored or caught by programs and the book makes special highlight of the interrupt signal, which can come from a user pressing the right key sequence. The tutorial explains 3 ways the signals are generally handled in a shell: the active program might die due to interrupt, the shell itself ignores the interrupt signal, and tools like ed(1) catches the signal and uses it to abort the current action (like printing) without exiting.

In case you were really wondering about the origins of the SIGHUP signal, this book's "UNIX for Beginners" chapter explains that "hanging up the phone will stop most programs."

Also covered are position parameters ($1, $2, ...), variables such as PATH, HOME, and PS1 (your shell prompt), "Command substitution" aka `stuff in backticks`, special variables like $#, $?, $$, and more. Keyword paramters also are documented here and how they relate to the environment (things like "FOO=hello ./mycommand arg1..." where FOO is an environment variable passed to ./mycommand.

Pipes, input redirection, process backgrounding, nohup, etc. All talked about here.It also has a pile of sample scripts, including this one called "null" which is a 1980's UNIX version of the modern touch(1) command:

#       usage: null file
#       create each of the named files as an empty file
for eachfile
do
        > $eachfile
done
When we run this on Ubuntu 9.04 in /bin/sh, it still works.
% sh null.sh a b c d e
% ls
a  b  c  d  e  null.sh*

Basically, The unix shell (linux, freebsd, etc, too) hasn't changed much in 30 years. The concepts, implementations, and syntax are, for the most part, exactly the same. Some important quotes from this tutorial from a section titled "Effective and Efficient Shell Programming:"

"In the author's opinion, the primary reason for choosing the shell procedure as the implementation method is to achieve a desired result at a minimum human cost."
"One should not worry about optimizing shell procedures unless they are intolerably slow or are known to consume a lot of resources."
"Emphasis should always be placed on simplicity, clarity, and readability."
Other sections in the "UNIX Programming Starter Package" includes a C reference and UNIX system reference, which details important concepts such as "everything is a file descriptor" among the general programming library reference.

I skipped the first section in this book, which contains a very excellent introduction to ed(1), which, as you should guess by now, is still totally valid documentation today. If you've never used ed(1), learning about it shows distinct ancestry to ex(1) and it's successor, vi(1).

The second Bell Labs UNIX manual I have is "UNIX Text Editing & Phototypesetting Starter Package." That's quite a mouthful of title! It goes extensively into how to use ed(1) and other tools that would help you edit stuff. Past that, it dives head first into troff/nroff, mm, tbl (table formatting), and eqn (math formulas). Reflecting on the general syntax of troff/nroff, and comparing that with HTML, Markdown, whatever random wiki markups are floating about, etc, I don't really feel like we've made progress much progress since troff.

In case you weren't aware, all your manpages are written in modern nroff.

% gzip -dc /usr/share/man/man1/sh.1.gz | less
< I skipped the copyright stuff >
.Dd January 19, 2003
.Os
.Dt SH 1
.Sh NAME
.Nm sh
.Nd command interpreter (shell)
.Sh SYNOPSIS
.Nm
.Bk -words
.Op Fl aCefnuvxIimqVEb
.Op Cm +aCefnuvxIimqVEb
So, besides a fun history lesson, what are the take aways? Personally, I use some of this material for interview questions. Pillars of UNIX that are still valid today are quite meaningful and useful to know, and I just might expect you to understand them if the position demands it.

I have a few photos of the books and content on Flickr.

Further reading:

December 24, 2009

Day 24 - Config Management with Cfengine 3

This article was written by Aleksey Tsalolikhin. If you are already using another automation tool, and even have no plans to change, this article may help you understand where much of today's config management and automation concepts came from.

Cfengine3 marks the third major version of the original configuration management software that started 16 years ago. Like Puppet, Chef, Bcfg2, and others, Cfengine helps you automate the configuration and maintenance of your systems.

I chose cfengine because of it's long track record, large user base, academic origins, wide platform support, and supportive community.

For the uninitiated, configuration management tools help you maintain a desired configuration state. If the system is not in the correct state, the config management tool will perform actions to move into the correct state. For example, if your state includes a cron job, and one of the systems doesn't have that cron job, the config management tool will install it. No action would be taken if the cron job already existed correctly.

Cfengine has its own configuration language. This language allows you to describe how things should be (state) and when necessary, describe how to do it or what to do. Using this language you create configuration "policy rules" or "promises" of how the system should be configured. Cfengine manages how to get to the promised state automatically.

In this way, Cfengine becomes your automated systems administrator, a kind of robot that maintains your system by your definitions. As exampled above: if a cron job is missing, and you said you wanted it, Cfengine will add it.

Your job then is promoted to one of configuring this automated system and monitoring its function. You can configure it to add cron jobs, upgrade software packages, or remove users, on thousands of hosts as easily as on one host. Use this tool with care ;)

Cfengine can be used standalone or in a client-server model. In the latter, if the server is unreachable, the client is smart and uses the last-seen cached set of policies and uses those until it can reach the server again. In either model, the client-side performs the checks and maintenance actions, so this should scale to thousands of hosts.

Speaking of using Cfengine, the language syntax in the latest version (3) has been cleaned up from the previous version, which had grown to be varied and inconsistent.

When using Cfengine, it's important to know some terms:

Promise
A promise is a Cfengine policy statement - for example, that /etc/shadow is only readable by root - and it implies Cfengine will endeavor to keep that promise.
Pattern
I asked Mark to clarify for us what he means by "patterns" in Cfengine 3. Here is his answer:
A "configuration" is a design arrangement or a pattern you make with system resources. The cfengine language makes it easy to describe and implement patterns using tools like lists, bundles and regular expressions. While promises are things that are kept, the efficiencies of configuration come from how the promises form simple re-usable patterns.
Class
For you programmers, this has nothing to do with the Object-Oriented term. Classes are "if/then" tests but the test itself is hidden "under the hood" of Cfengine. There is no way to say "if/then" in Cfengine except with classes. Example - this shell script will only be executed on Linux systems:
shellcommands:
    linux:: "/var/cfengine/inputs/sh/my_script.sh"
There are a number of built-in classes, like the linux class above; they can also be explicitly defined.
Bundle
A bundle is a collection of promises
Body
The body of a promise explains what it is about. Think of the body of a contract, or the body of a document. Cfengine "body" declarations divide up these details into standardized, paramaterizable, library units. Like functions in programming, promise bodies are reusable and parameterized.
  cfengine-word => user-data-pattern

  body cfengine-word user-data-pattern
  {
      details
  }
The basic grammar of Cfengine 3 looks like this:
  promisetype:
      classes::
          "promiser" -> { "promisee1", "promisee2", ... }
              attribute_1 => value_1,
              attribute_2 => value_2,
              ...
              attribute_n => value_n;
Classes are optional. Here is the list of promise types:
  • commands - Run external commands
  • files - Handle files (permissions, copying, etc.)
  • edit_line - Handle files (content)
  • interfaces - Network configuration
  • methods - Methods are compound promises that refer to whole bundles of promises.
  • packages - Package management
  • processes - Process management
  • storage - Disk and filesystem management
Here's another example:
    files:
       "/tmp/test_plain" -> "John Smith",
            comment => "Make sure John's /tmp/test_plain exists",
            create  => "true";
Above, we have the promisee on the right side of the arrow. The promisee is "the abstract object to whom the promise is made". This is for documenation. The commercial version of cfengine uses promisees to generate automated knowledge maps. The object can be the handle of another promise with an interest in the outcome or an affected person who you might want to contact in case of emergency.

How about a more complete and practical example? Lets ensure some ntp and portmap services are running:

body common control
{
  # We can give this a version
  version => "1.0";
  # specify what bundles to apply
  bundlesequence  => { "check_service_running"  };
}

bundle agent check_service_running
{
    vars:
        # name    type  =>    value
        "service" slist => {"ntp", "portmap"};
        "daemon_path" string => "/etc/init.d";

    processes:
        "$(service)"
            comment => "Check processes running for '$(service)'",
            restart_class => "restart_$(service)";

    commands:
        "${daemon_path}/${service} start"
            comment => "Execute the start command for the service",
            ifvarclass => "restart_${service}";
}
Saving this as 'servicecheck.cf' we can test it in standalone mode with cf-agent:
% sudo /etc/init.d/portmap status
 * portmap is not running
% sudo /etc/init.d/ntp status    
 * NTP server is not running.

% sudo cf-agent -f ./servicecheck.cf
Q: "...init.d/ntp star":  * Starting NTP server ntpd
Q: "...init.d/ntp star":    ...done.
I: Last 2 QUOTEed lines were generated by promiser "/etc/init.d/ntp start"
I: Made in version '1.0' of './servicetest.cf' near line 20
I: Comment: Execute the start command for the service

Q: "....d/portmap star":  * Starting portmap daemon...
Q: "....d/portmap star":    ...done.
I: Last 2 QUOTEed lines were generated by promiser "/etc/init.d/portmap start"
I: Made in version '1.0' of './servicetest.cf' near line 20
I: Comment: Execute the start command for the service

# Now check to make sure cfengine started our services:
% sudo /etc/init.d/portmap status
 * portmap is running
% sudo /etc/init.d/ntp status    
 * NTP server is running.
Configuration management is an essential tool for sane and happy sysadmins. They help you ensure your systems are correctly configured without repeatedly consuming your time fighting to maintain the status quo.

Further reading:

December 23, 2009

Day 23 - The Dungeon Master's Guide to IT: A Standards Primer

This article written by Ben Rockwood.

A couple weeks ago, I was trying to architect the next evolution of security infrastructure and made an outline of major areas in which I need to focus. Pondering the list it occurred to me that it looked like the table of contents of a standard. I'd never really paid much attention to them, after all, everyone gripes about them and claims they are bureaucratic trash imposed on good engineers by dim-witted management. Why waste my time?

But then, I stepped back, with a child's eye, and admitted to myself that I really had no idea what any of this stuff meant. After all, thats the problem with security: when are you done? When can you say "Great! Its secure!" and move on? I've always hate security, and I think this ambiguity was precisely why.

So I brew a strong pot of coffee and create a new page in my wiki: "Industry Standards". Like many SysAdmin's I first need to get a "lay of the land", to orient myself in the subject before diving into components. ... About a week later, I think I'd started to make headway. I had no idea just how deep the rabbit whole went and quickly became obsessed with the subject.

Several things became clear during my studies. The first was that IT is struggling to leave adolescence and grow into manhood. The one thread that runs through all standards and frameworks out there is that IT can no longer be a special ops part of the company. Rather, it needs to mature and integrate with the larger corporation just like sales or marketing or facilities.

There are several reasons IT needs to stop being the corporate step-child and come under the fold, chief among them SOX compliance. Prior to SOX it was easy for management to say "Look, I don't want to know all this tech crap, just make sure our people have what they need and do your job." The blind eye of management. But with SOX, it became clear that the IT folks hold all the keys to the corporate data kingdom and needed strict oversight. I mean, the government is putting the pressure on finance, its only a matter of time they put the pressure on the people that keep the data that finance is reporting on. Is the data managed properly? Is the data secure? Is the data protected? What started with accountants is now putting the entire IT operation into question.

Thanks to SOX ambiguity, people start searching for solutions to help them comply, and thankfully a great deal of work had already been done. Thus, a variety of "frameworks" to implement controls (procedures and checks that keep things on the up-and-up; like the guy that works the register doesn't count it). Quickly auditors started agreeing that the best way to fill in the missing regulatory gaps was simply to verify the company against these frameworks and an industry of compliance and standards writing took on a whole new life.

When looking at standards there are some details to understand up front. There are "standards specification" or "requirements" that you actually can be certified against. There are "frameworks" which are series of controls which are basically like Dungeons & Dragons DM Guides, they tell you how to play the game. Lastly, there is "guidance" or "best practice", which aren't standards in the sense that you certify against them but rather you use them to help you implement the standard.

So lets start at the top: COSO. COSO is an internal control framework for corporations created in 1985 to combat the fraud and bad financial reporting of the 70's and 80's. Companies would voluntarily adopt COSO as a framework in which to run their business.

Modeled after COSO, the COBIT (Control Objectives for Information and related Technology) framework was created for IT governance. Instead of being aimed at top management on how to run the company in a responsible way, like COSO, it outlines how the IT organization should interact with the company as a whole. It tells the CEO what to expect from IT and what IT should do for the CEO.

COBIT plays a big role in de-geek-ifying IT and making it a more integrated part of the overall business, with roles and responsibilities and processes. Some of its controls include managing people, quality, problems, assets, and all sorts of not so fun stuff.

COBIT is a great framework, but how do you certify your organization? How do you implement it? This is where ITIL and ISO20K come in.

Of all the IT standards guidance, the Information Technology Infrastructure Library (ITIL), has gotten the most interest. Currently in its 3rd version, ITIL is nothing more than a series of 5 books (expensive books, $600 for the set) that define IT Service Management (ITSM) best practice guidance. The emphasis is that IT is a service organization and should align itself to service the greater corporation, so it directly supports the direction set by COBIT. However, the two are distinct and not dependent on each other.

Whether you're trying to become a compliant organization or you simply want some ideas on how to properly structure an IT group, ITIL has become the defacto authority on the subject.

Inevitably, you'll want to certify that you're running a well-oiled IT organization and that your IT governance is up to spec, and so ISO 200000-1 (ISO20K) defines "Information Technology - Service Management: Specification". If you're looking for SOX compliance this is one you may need to audit against. But lets step back.

ISO20K can provide SysAdmin's in the trenches with something very useful, a checklist that outlines what a proper IT organization should look like. Are you doing problem management? Configuration management? Change management? Do you see the value in these processes or are they just a burden? How should an IT organization be organized and run? ISO20K can help bring all these questions into a structured discussion and thought exercise. Maybe you don't agree with parts of it, or think its too much, but ISO20K gives us a stick in the sand to orbit and ponder.

So, to review so far, the big guys use the COSO framwork, the IT guys use the COBIT framework, and they turn to ITIL for guidance and certify itho touches credit card data. The telecom industry gave us TIA-942, the "Telecommunications Infrastructure Standard for Data Centers". On and on and on.

In addition to these, I want to point out that they bump up against the two big project management standards as well, namely the popular US standard PMBOK ("Project Management Body of Knowledge") and the popular European standard PRINCE2 ("PRojects IN Controlled Environments"). Whether or not you care much about project management, when you get into the standards would you will see these two pop up from time to time, so at least learn to recognize them.

--

So why am I writing sysadmins about all this? Because I think generally we're a very curious bunch and have a natural desire to organize things into efficient systems. While we also have a gung-ho DIY instinct, ultimately we do realize that having at least some point of reference is a useful measure.

Whether your in a shop thats implementing standards and your only seeing the tasks without the big picture, or your the big man in a small shop wondering how to better organize your shop, these standards and frameworks can really help you both better understand the direction of the industry and provide a helpful second opinion on your method. No process created in committee will be perfect for your specific needs, but I encourage you to at least educate yourself and see if it doesn't change the way you think about your job.

The important takeaway is this: all these standards and frameworks and guidance are just books! Read them. Understand them as much as you can. Some are free and some are not but seek them out and you'll find them. Knowledge really is power and if you want to play a bigger role in your organization or prepare yourself for the future this is the to start.

Further reading:

December 22, 2009

Day 22- Lessons in Migrations

This article was written by Saint Aardvark the Carpeted

I've been through two big moves in my career. The first was about four years ago when the company I was working for moved offices. It was only across the street, but it meant shifting the whole company over. We had about forty employees at the time, and maybe a hundred workstations, test servers, and production servers.

The second move was when, earlier this year at my current job, we finally got to move into our new server room. This time the scope of the move was smaller (no workstations, and about twenty servers), but the new digs were nicer. :-)

I learned a lot from these two moves. I want to pass those lessons on to you.

Have a second set of skilled hands around

At both places, I was the only sysadmin on staff. For the first move, my company hired a consultant for a few days to help me out with the move and its aftershocks. It was great to have someone else around that could help diagnose email problems, run traceroute and generally run interference while I swore at the servers.

The second time, I thought that four volunteers, plus me, would be enough... it was only twenty servers, after all. Mainly, it would be a question of cabling, then things would just fall into place after that... right?

Well, the volunteers were excellent -- I can't say enough about them, but a second set of skilled hands would have simplified things a lot. I found myself often switching between them as questions came up: How do these rack rails work? Which interface is eth0? Did you really mean to put 8U of servers into 4U of space?

Obviously, someone familiar with your network, OS/distro and thought patterns can help you with network testing, re-jigging Apache proxy directives, and finding your pizza coupons. Even something as simple as being familiar with rack rails helps a lot.

And if you're moving offices, don't do this without the support of your company. For the first move there were three of us -- including the CEO -- and I wouldn't want to do it with less bodies or less influence.

Don't underestimate how tired you'll be

In some ways, the first move was easier despite it being much more involved. We moved on a Saturday, I got machines up and running on Sunday, and on Monday, things were mostly working again. Knowing that I had the time meant that I could go home with a clear conscience.

The second move, though, was meant to be done in one day. It was gonna be simple: I had a checklist for services and boot order, the network settings were ready to go, and the new server room was quite close our old server room. How long could it take to move stuff two blocks?

Well, the moving took the morning. De-racking machines, getting stuff on the elevator and to the truck (thank goodness for strong movers), then dropping stuff off in the server room left us in a good position for lunch.

But after lunch, little things cropped up: I'd borked some netmask settings on a couple key servers. The rack I'd planned to put the firewall in was too shallow to accept it. My placement of the in-rack switches blocked some PDU outlets. Some of the rack rails were fragile, stupidly constructed, and difficult to figure out.

Each of these things were overcome, but it took time. Before I knew it, it was 7:15pm, I'd been at it for 11 hours and I was exhausted. I had to head home and finish it the next day. Fortunately, I had the support of my boss in this.

Don't make the day any worse than it has to be

At the first move, I'd decided it would be a good idea to switch to a new phone vendor as we moved into the new building.

I avoided firing by, I later calculated, the skin of my teeth.

Your move will be long. It will be stressful. You will trip over things you didn't plan for, thought you'd planned for, and were sure someone else was planning for. Don't add to the misery by making another big change at the same time. This goes double for anything involving a complicated technology with multiple vendors (including a local monopoly that Does Not Like competition) that will leave everyone very upset if it fails to work right when they come in.

Instead, mark it carefully on your calendar for five years in the future.

Set up monitoring early

For the second move, my Nagios box was second on my list of machines to boot up. I'd set it up with new addresses ahead of time, and made sure when it did start that alerts were turned off.

As machines came up, I watched the host and service checks turn green. It was a good way to ensure that I hadn't forgotten anything...if it failed, I'd either forgotten to update the address or I had a genuine problem. Either way, I knew about it quickly, and could decide whether to tackle it right away or leave it for later.

Don't forget about cabling

I planned out a lot of things for my second move, and it served me well. Service checklists, boot sequences...it had taken a long time, but it was worth it. I even had a colour-coded spreadsheet showing how many rack units, watts and network cables I'd need for each server.

Unfortunately, what I missed was thinking about the cabling itself. I'd picked out where the switch in each rack would go, I'd made sure I had lots of cables of varying lengths around, and so on. But there were some things I'd missed that experience -- or a dry run -- would have caught:

  • Horizontal cable management bars blocked a couple of PDU outlets each; this was mostly, but not entirely, unavoidable.
  • PDU outlets were on the wrong side for most -- but not all -- servers, which put power cables right next to network cables.
  • The switches were right next to some PDU outlets -- and since the switch outlets went all the way to the side, that meant some network cables were right next to power cables.

A dry run of the cabling would not have been easy. I didn't have a spare server to rack and check for problems, and some of these things only emerged when you had a full rack. But it would have been a lot less work than doing it all on the day of the move (let alone swearing at it and leaving it for Christmas maintenance).

Getting new equipment? Make sure it works

As part of the new server room, we got a few bells and whistles. Among them were a humidifier (necessary since we didn't have a vapour barrier) and leak detectors that sat on the floor, waiting to yell at me about floods. "Woohoo!" I thought. "We're movin' on up!"

What I didn't think about was how these things worked...or rather, how I could tell that they worked. We moved in during summer, so the humidifier wasn't really necessary. But when winter came around and the humidity dropped to 15%, I realized that I had no idea how to tell if the thing was working. And when I dug up the manual, I had no idea what it was talking about.

Same with the leak detection. I knew it was there, since the sub-contractor had pointed it out. I had assumed it was managed by the monitoring box that had been installed along with it...and since I was busy right then moving in boxes and getting NFS working, I put it on the list of stuff to do later.

When I finally did tackle it later, it turned out I was wrong: it wasn't part of the other monitoring box. The box I needed to query didn't show anything about a leak detector. And I had no idea how to test the leak detection once I did figure it out.

In both cases, I erred by assuming that I could figure things out later. Most of the time, I can -- and being handy at figuring things out goes with the job. But there are limits to our expertise, our area of familiarity, and our ability to learn whole technologies at one sitting. One of the hardest things I've had to realize is that, while I like to think I'm capable of learning just about anything I'm likely to try my hand at, it's not practical -- that there are times when you have to give up and say, "That's just something I'll have to learn in my next life."

I also erred by not asking the installer to walk me through things. I should have asked for simple steps to test whether they were working, how to check for problems, and how to reset them.

Conclusion

Moving tests things and people. You (re-)learn what you forgot about; you find out how to do without missing parts; you come to terms with the limits of being human. It's no less true for being melodramatic, but a few tricks, some obsessive planning, foolhardy volunteers, and hard work will give you the best war story of all: a boring one, where everything worked out just fine in the end.

Further reading:

December 21, 2009

Day 21 - collectd

Collectd is a statistics collection tool I've recently found quite useful. Other tools in this space include Munin, Cacti, and Ganglia. For starters, collectd can collect at fairly high frequencies (the default is every 10 seconds) relative to other collection tools. The config syntax is consistent and looks similar to Apache httpd's config syntax. As a bonus, it comes with almost a hundred plugins to help you get statistics from devices and applications and into RRD files (and other outputs, if you want). Each plugin has a host of different configuration options it can support, including changing the collection interval.

Reading over the project's website, I noticed a few things that struck me as good things. It's important to mention that the reason I noticed these things was because the project has quite good documentation.

First, there is the the network plugin., which allows you to send and receive collectd data to and from other collectd instances, or anything that speaks the collectd network protocol. Many networking scenarios are supported: unicast, multicast, and even proxying. Second, many plugins have reasonable configuration defaults. For example, the interface plugin defaults to capturing stats on all interfaces. Addtionally, the default plugin set includes ones to capture data from other systems like Ganglia and JMX. Other base plugins allow you to easily fetch values from databases (DBI), web servers (cURL), and scripts (Exec).

The DBI and cURL plugins cover a pretty wide area of uses, and the Exec plugin is useful when you can't find a plugin that does exactly what you want. The benefit here is that you may not have to write a complex script just to fetch a value from a database or webserver just to store that data with collectd. The DBI plugin even supports using specific column values as fields and others as collectd values, rather than having statically defined fields. I like.

Other nice features include the ability to filter collected data, possibly modifying it before it gets written to disk. The project also comes with a useful tool called collectd-nagios which allows you to use collectd data for nagios checks. This lets you make collectd do the hard work of collecting the data and lets you use the nagios plugin to simply set alert thresholds.

When playing with collectd and when reading the docs, I haven't seen any points where I have found myself worrying about the difficulty in automating collectd's configuration.

So, what's bad? Collectd itself doesn't do graphs for you; it acts as a data collection system only. If you want graphs from the RRDs it stores, you'll need to use the decent-but-not-superb web interface called 'collection3' that comes with collectd in the contrib directory. There are other projects, like Visage, that are working on providing a better interface to the data collectd records. I started with collection3, which looks like this:

I circled the navigation overlay that collection3 puts on the graphs. These allow you to pan/zoom around to various time views - a very important feature of any graph view system. Definitely a win.

For fun, I decided to use the cURL plugin to fetch a random number from random.org. That configuration looks like this:

<Plugin curl>
  <Page "random_number">
    URL "http://www.random.org/integers/?num=1&min=1&max=100&col=1&base=10&format=plain&rnd=new"
    <Match>
      Regex "([0-9]+)"
      DSType "GaugeAverage"
      Type "percent"
      Instance "randomvalue"
    </Match>
  </Page>
</Plugin>

Resulting graph looks like this after letting collectd run for a few minutes:

The good documentation and nice set of features were what convinced me to try collectd. The default configuration includes a few plugins and writes out RRDs as expected, and it was easy to add new collections from different plugins (like the random.org curl one, above).

Further reading:

  • RRDtool - data storage and graphing system for time series data. Used by collectd, Munin, Ganglia, Cacti, etc...
  • cURL is a tool and library for fetching URLs
  • things related to collectd on collectd's wiki

December 20, 2009

Day 20 - Becoming a Sysadmin

This article written by Ben Cotton. Editor's thoughts: This may seem like an odd choice of content, but sometimes it is as important to know where we came from as it is to plan where we are going. Did you choose systems administration, or did it choose you?

This post was inspired by my brother-in-law asking me what seemed like a simple question, "how do I become a sysadmin?" It turns out the answer is not so easy.

The title, "systems administrator," is sufficiently vague so as to be completely useless as a description of one's job duties. I've written in the past about the variety of tasks a sysadmin might encounter in a given day. With such a range of duties, it should come as no surprise that there's more than one path to becoming a sysadmin. Knowing a wider sample of individuals would better capture all the possibilities, so I posed a simple question to respected colleagues and to the community at ServerFault: how did you become a sysadmin?

It turns out that very few people dream of becoming a sysadmin as a child. Most sysadmins got their start by combining an interest in computers with another interest or skill. The combination isn't always intentional. Some people just happened to fix the right person's computer one day or got saddled with systems administration on top of their regular job duties. For others, it is the natural next step. An experienced developer who no longer feels like developing is often a great candidate to maintain the systems that the developers use. Many others move up through the ranks, starting out at the help desk and gradually gaining knowledge and responsibility. One person's career path even made a brief stop as a strip club bouncer.

For many people, myself included, there was little formal training in computers. My degree is in meteorology, and I know of several people who got started in the sciences or engineering. The reason for their success is two-fold. In academic environments, it helps to understand the science behind the work the users are doing. The other reason is that scientists and engineers are trained to think a certain way - to approach and solve problems in a logical and systematic manner. The fundamental job of a system administrator is to solve problems or anticipate future problems, so having a scientific mindset is a strong asset.

So if formal training in computers isn't necessary to become a sysadmin, what is?

The willingness to learn is key. A successful sysadmin spends a lot of time learning, whether it is about new software, new hardware, new processes, or USB missile launchers. If you want to become a sysadmin, the first thing you need to do is to start learning. The learning can be accomplished in many ways. Formal education, in the form of classes or vendor-provided training, can be very valuable. Learning at the shoulder of someone more experienced provides some gaps, but gives you knowledge that can only come from experience. And of course, there's self-education. The bulk of my early learning came from tinkering with (and breaking) my own computers, and by reading "___ For Dummies" books. It's amazing what you learn when you have to fix your mistakes.

So what do you need to learn? Everything. I won't get into the technical skills, because those will vary from position to position. I mean, you might need to know how to set up an Exchange server, or how to tune NFS performance, or how to manage a print server, or...well, you get the idea. To really be a successful sysadmin, you need to learn some indispensable, if tangential, skills. Technical documentation may be the most important skill for sysadmins, because you will at some point forget every important piece of information that you need to know. Writing documentation for users is also invaluable, especially if you want to spend less time answering questions. Project management, personnel management, and budgeting skills also come in handy.

Armed with all of this knowledge, you're ready to become a sysadmin and find out how much you don't know (hint: no matter how much you know, there's always more that you don't). Getting the first job is the hardest, and you might need to start out doing non-sysadmin work. Help desk support, programming, or anything else that gets you in the door gives you the opportunity to start learning new skills and taking on responsibilities. The only common theme among the answers I received is that there's no common education, minimum skills requirement, or career path. Each sysadmin path is unique. I'll leave you with a few of the most amusing quotes:

"I think I did something horrible to someone in a previous life and this was my punishment. Anyone else feel like that?"
"Enlisted in the Army for a completely unrelated job. Made the mistake of fixing the commander's email. Voila! I became a sysad."
"I am a sysadmin because one beautiful summer day, I found a computer laying in a field."
"Why would someone want to get into this job? I strongly suggest he get into driving heavy machinery. That's what I'm gonna do when I grow up."

Further reading:

December 19, 2009

Day 19 - Kanban for Sysadmins

This article written by Stephen Nelson-Smith

Unless you've been living in a remote cave for the last year, you've probably noticed that the world is changing. With the maturing of automation technologies like Puppet, the popular uptake of Cloud Computing, and the rise of Software as a Service, the walls between developers and sysadmins are beginning to be broken down. Increasingly we're beginning to hear phrases like 'Infrastructure is code', and terms like 'Devops'. This is all exciting. It also has an interesting knock-on effect. Most development environments these days are at least strongly influenced by, if not run entirely according to 'Agile' principles. Scrum in particular has experienced tremendous success, and adoption by non-development teams has been seen in many cases. On the whole the headline objectives of the Agile movement are to be embraced, but the thorny question of how to apply them to operations work has yet to be answered satisfactorily.

I've been managing systems teams in an Agile environment for a number of years, and after thought and experimentation, I can recommend using an approach borrowed from Lean systems management, called Kanban.

Operations teams need to deliver business value

As a technical manager, my top priority is to ensure that my teams deliver business value. This is especially important for Web 2.0 companies - the infrastructure is the platform -- is the product -- is the revenue. Especially in tough economic times it's vital to make sure that as sysadmins we are adding value to the business.

In practice, this means improving throughput - we need to be fixing problems more quickly, delivering improvements in security, performance and reliability, and removing obstacles to enable us to ship product more quickly. It also means building trust with the business - improving the predictability and reliability of delivery times. And, of course, it means improving quality - the quality of the service we provide, the quality of the staff we train, and the quality of life that we all enjoy - remember - happy people make money.

The development side of the business has understood this for a long time. Aided by Agile principles (and implemented using such approaches as Extreme Programming or Scrum) developers organise their work into iterations, at the end of which they will deliver a minimum marketable feature, which will add value to the business.

The approach may be summarised as moving from the historic model of software development as a large team taking a long time to build a large system, towards small teams, spending a small amount of time, building the smallest thing that will add value to the business, but integrating frequently to see the big picture.

Systems teams starting to work alongside such development teams are often tempted to try the same approach.

The trouble is, for a systems team, committing to a two week plan, and setting aside time for planning and retrospective meetings, prioritisation and estimation sessions just doesn't fit. Sysadmin work is frequently interrupt-driven, demands on time are uneven, frequently specialised and require concentrated focus. Radical shifts in prioritisation are normal. It's not even possible to commit to much shorter sprints of a day, as sysadmin work also includes project and investigation activities that couldn't be delivered in such a short space of time.

Dan Ackerson recently carried out a survey in which he asked sysadmins their opinions and experience of using agile approaches in systems work. The general feeling was that it helped encourage organisation, focus and coordination, but that it didn't seem to handle the reactive nature of systems work, and the prescription of regular meetings interrupted the flow of work. My own experience of sysadmins trying to work in iterations is that they frequently fail their iterations, because the world changed (sometimes several times) and the iteration no longer captured the most important things. A strict, iteration-based approach just doesn't work well for operations - we're solving different problems. When we contrast a highly interdependent systems team with a development team who work together for a focussed time, answering to themselves, it's clear that the same tools won't necessarily be appropriate.

What is Kanban, and how might it help?

Let's keep this really really simple. You might read other explanations making it much more complicated than necessary. A Kanban system is simply a system with two specific characteristics. Firstly, it is a pull-based system. Work is only ever pulled into the system, on the basis of some kind of signal. It is never pushed; it is accepted, when the time is right, and when there is capacity to do the work. Secondly, work in progress (WIP) is limited. At any given time there is a limit to the amount of work flowing through the system - once that limit is reached, no more work is pulled into the system. Once some of that work is complete, space becomes available and more work is pulled into the system.

Kanban as a system is all about managing flow - getting a constant and predictable stream of work through, whilst improving efficiency and quality. This maps perfectly onto systems work - rather than viewing our work as a series of projects, with annoying interruptions, we view our work as a constant stream of work of varying kinds.

As sysadmins we are not generally delivering product, in the sense that a development team are. We're supporting those who do, addressing technical debt in the systems, and looking for opportunities to improve resilience, reliability and performance.

Supporting tools

Kanban is usually associated with some tools to make it easy to implement the basic philosophy. Again, keeping it simple, all we need is a stack of index cards and a board.


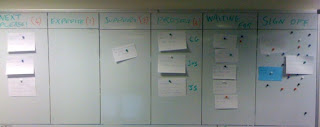
Stephen's (the author) Kanban board.

The word Kanban itself means 'Signal Card' - and is a token which represents a piece of work which needs to be done. This maps conveniently onto the agile 'story card'. The board is a planning tool, and and an information radiator. Typically it is organised into the various stages on the journey that a piece of work goes through. This could be as simple as to-do, in-progress, and done, or could feature more intermediate steps.

The WIP limit controls the amount of work (or cards) that can be on any particular part of the board. The board makes visible exactly who is working on what, and how much capacity the team has. It provides information to the team, and to managers and other people about the progress and priorities of the team..

Kanban teams abandon the concept of iterations altogether. As Andrew Shafer once said to me: "We will just work on the highest priority 'stuff', and kick-ass!"

How does Kanban help?

Kanban brings value to the business in three ways - it improves trust, it improves quality and it improves efficiency.

Trust is improved because very rapidly the team starts being able to deliver quickly on the highest priority work. There's no iteration overhead, it is absolutely transparent what the team is working on, and, because the responsibility for prioritising the work to be done lies outside the technical team, the business soon begins to feel that the team really is working for them.

Quality is improved because the WIP limit makes problems visible very quickly. Let's consider two examples - suppose we have a team of four sysadmins:

The team decides to set a WIP limit on work in progress of one. This means that the team as a whole will only ever work on one piece of work at a time. While that work is being done, everything else has to wait. The effects of this will be that all four sysadmins will need to work on the same issue simultaneously. This will result in very high quality work, and the tasks themselves should get done fairly quickly, but it will also be wasteful. Work will start queueing up ahead of the 'in progress' section of the board, and the flow of work will be too slow. Also it won't always be possible for all four people to work on the same thing, so for some of the time the other sysadmins will be doing nothing. This will be very obvious to anyone looking at the board. Fairly soon it will become apparent that the WIP limit of one is too low.

Suppose we now decide to increase the WIP limit to ten. The syadmins go their own ways, each starting work on one card each. The progress on each card will be slower, because there's only one person working on it, and the quality may not be as good, as individuals are more likely to make mistakes than pairs. The individual sysadmins also don't concentrate as well on their own, but work is still flowing through the system. However fairly soon, something will come up which makes progress difficult. At this stage a sysadmin will pick another card and work on that. Eventually two or three cards will be 'stuck' on the board, with no progress, while work flows around them owing to the large WIP limit. Eventually we might hit a big problem, system wide, that halts progress on all work, and perhaps even impacts other teams. It turns out that this problem was the reason why work stopped on the tasks earlier on. The problem gets fixed, but the impact on the team's productivity is significant, and the business has been impacted too. Has the WIP limit been lower, the team would have been forced to react sooner.

The board also makes it very clear to the team, and to anyone following the team, what kind of work patterns are building up. As an example, if the team's working cadence seems to be characterised by a large number of interrupts, especially for repeatable work, or to put out fires, that's a sign that the team is paying interest on technical debt. The team can then make a strong case for tackling that debt, and the WIP limit protects the team as they do so.

Efficiency is improved simply because this method of working has been shown to be the best way to get a lot of work through a system. Kanban has its origins in Toyota's lean processes, and has been explored and used in dozens of different kinds of work environment. Again, the effects of the WIP limit, and the visibility of their impact on the board makes it very easy to optimise the system, to reduce the cycle time - that is to reduce the time it takes to complete a piece of work once it enters the system.

Another benefit of Kanban boards is that it encourages self-management. At any time any team member can look at the board and see at once what is being worked on, what should be worked on next and, with a little experience, can see where the problems are. If there's one thing sysadmins hate, it's being micro-managed. As long as there is commitment to respect the board, a sysops team will self-organise very well around it. Happy teams produce better quality work, at a faster pace.

How do I get started?

If you think this sounds interesting, here are some suggestions for getting started.

  • Have a chat to the business - your manager and any internal stakeholders. Explain to them that you want to introduce some work practices that will improve quality and efficiency, but which will mean that you will be limiting the amount of work you do - i.e. you will have to start saying no. Try the puppy dog close: "Let's try this for a month - if you don't feel it's working out, we'll go back to the way we work now".

  • Get the team together, buy them pizza and beer, and try playing some Kanban games. There are a number of ways of doing this, but basically you need to come up with a scenario in which the team has to produce things, but the work is going to be limited and only accepted when there is capacity. Speak to me if you want some more detailed ideas - there are a few decent resources out there.

  • Get the team together for a white-board session. Try to get a sense of the kinds of phases your work goes through. How much emergency support work is there? How much general user support? How much project work? Draw up a first cut of a Kanban board, and imagine some scenarios. The key thing is to be creative. You can make work flow left to right, or top to bottom. You can use coloured cards or plain cards - it doesn't matter. The point of the board is to show what work is being done, by whom, and to make explicit what the WIP limits are.

  • Set up your Kanban board somewhere highly visible and easy to get to. You could use a whiteboard and magnets, a cork board and pins, or just stick cards to a wall with blue tack. You can draw lines with a ruler, or you can use insulating tape to give bold, straight dividers between sections. Make it big, and clear.

  • Agree your WIP limit amongst yourselves - it doesn't matter what it is - just pick a sensible number, and be prepared to tweak it based on experience.

  • Gather your current work backlog together and put each piece of work on a card. If you can, sit with the various stakeholders for whom the work is being done, so you can get a good idea of what the acceptance criteria are, and their relative importance. You'll end up with a huge stack of cards - I keep them in a card box, next to the board.

  • Get your manager, and any stakeholders together, and have a prioritisation session. Explain that there's a work in progress limit, but that work will get done quickly. Your team will work on whatever is agreed is the highest priority. Then stick the highest priority cards to the left of (or above) the board. I like to have a 'Next Please' section on the board, with a WIP limit. Cards can be added or removed by anyone from this board, and the team will pull from this section when capacity becomes available.

  • Write up a team charter - decide on the rules. You might agree not to work on other people's cards without asking first. You might agree times of the day you'll work. I suggest two very important rules - once a card goes onto the in progress section of the board, it never comes off again, until it's done. And nobody works on anything that isn't on the board. Write the charter up, and get the team to sign it.

  • Have a daily standup meeting at the start of the day. At this meeting, unlike a traditional scrum or XP standup, we don't need to ask who is working on what, or what they're going to work on next - that's already on the board. Instead, talk about how much more is needed to complete the work, and discuss any problems or impediments that have come up. This is a good time for the team to write up cards for work they feel needs to be done to make their systems more reliable, or to make their lives easier. I recommend trying to get agreement from the business to always ensure one such card is in the 'Next Please' section.

  • Set up a ticketing system. I've used RT and Eventum. The idea is to reduce the amount of interrupts, and to make it easy to track whatever work is being carried out. We have a rule of thumb that everything needs a ticket. Work that can be carried out within about ten minutes can just be done, at the discretion of the sysadmin. Anything that's going to be longer needs to go on the board. We have a dedicated 'Support' section on our board, with a WIP limit. If there are more support requests than slots on the board, it's up to the requestors to agree amongst themselves which has the greatest business value (or cost).

  • Have a regular retrospective. I find fortnightly is enough. Set aside an hour or so, buy the team lunch, and talk about how the previous fortnight has been. Try to identify areas for improvement. I recommend using 'SWOT' (strengths, weaknesses, opportunities, threats) as a template for discussion. Also try to get into the habit of asking 'Five Whys' - keep asking why until you really get to the root cause. Also try to ensure you fix things 'Three ways'. These habits are part of a practice called 'Kaizen' - continuous improvement. They feed into your Kanban process, and make everyone's life easier, and improve the quality of the systems you're supporting.

The use of Kanban in development and operations teams is an exciting new development, but one which people are finding fits very well with a devops kind of approach to systems and development work. If you want to find out more, I recommend the following resources:

  • the home of Kanban for software development; A central place where ideas, resources and experiences are shared.
  • mailing list for people deploying Kanban in a software environment - full of very bright and experienced people
  • the nascent devops movement
  • agile web operations - excellent blog covering all aspects of agile operations from a devops perspective
  • agile sysadmin - This author's own blog - focussed around the practical application of technology and agile processes to deliver business value

December 18, 2009

Day 18 - Who Watches the Watcher?

The health of your infrastructure relies on you. You rely on a monitoring system (Nagios, etc) to detect problems and repair them or notify you of them, but what monitors the monitor?

Assuming for the moment that Nagios is your monitor. What happens when Nagios crashes or gets stuck? What happens if a syntax error creeps in and causes Nagios to fail at startup? It may be up, but not behaving correctly; how do you know? Moreover, if you have automated processes for generating and deploying Nagios configs and even upgrading Nagios, how do you know if things are working?

You need notification when your monitoring system is malfunctioning just like you want notification for any other important problem. It's possible you've overlooked this when configuring your monitoring systems, and solving this takes some thought, because not every solution is a complete one.

One option to consider is having Nagios check it's config file for problems on startup, and alerts you (via mail, whatever) on errors. This can be done with nagios -v <configfile>, which exits nonzero if there are config errors. Conveniently, if 'nagios' the command fails for another reason like the package was uninstalled, a dependent library is missing, etc, this also results in a nonzero exit code. This solution fails, however, to alert you when Nagios crashes or hangs.

Another option is to test behavior. One behavior to observe is the modification dates on Nagios' stored results, like status.dat (status_file in nagios.cfg) or the checkresults directory (check_result_path in nagios.cfg). If these items haven't been modified recently, it's possible Nagios is unhappy.

Both of the above solutions are incomplete because they run local to the monitoring host, and if that host fails, you don't get any notification. A solution is to run your monitor on at least two hosts and have them monitor each other. Your second monitor can just be a metamonitor (a monitor monitoring a monitor!) that does nothing else. Just remember that you should also monitor your metamonitor (meta-metamonitor?), and this can be done from your first Nagios instance.

How do we remotely monitor Nagios? The status.dat file is used as a data source when you access the Nagios web interface. The default web interface has a link "Process Info" which points to http://.../nagios/cgi-bin/extinfo.cgi?type=0. Included in the process info report is the last time an external command was run. Here's a test written in ruby that will remotely verify Nagios is healthy and the last check time is within some threshold. Example using this script :

# with nagios down (stopped safely)
% ruby nagios-last-update.rb localhost 900
extinfo.cgi returned bad data. Nagios is probably down?

# Recently started, no checks run yet:
% ruby nagios-last-update.rb localhost 900
last external command time is 'N/A'. Nagios may have just restarted.

# Working
% ruby nagios-last-update.rb localhost 900
OK. Nagios last-update 2.814607 seconds ago.

# Web server is up, but nagios isn't running:
% ruby nagios-last-update.rb localhost 900
Time of last Nagios check is older than 900.0 seconds: 1434.941687

# Web server is down
% ruby nagios-last-update.rb localhost 900
Connection refused when fetching http://localhost/nagios/cgi-bin/extinfo.cgi?type=0

# Host is unresponsive:
% ruby nagios-last-update.rb localhost 900     
Timeout (30) while fetching http://localhost/nagios/cgi-bin/extinfo.cgi?type=0
The script uses the proper exit statuses (0 == OK, 1 == warn, 2 == critical) nagios checks expect. There may be exceptions I'm not catching that I should, but uncaught ruby exceptions cause an exit code 1, which Nagios (or whatever) should interpret as a check failure.

Now we have a way to remotely verify the health of a Nagios instance that tells us if Nagios is running properly. Plug this into a monitoring instance on a different host, and you should get alerts whenever your Nagios instance is down.

Further reading:

December 17, 2009

Day 17 - Monitoring with Xymon

This article was written by Kent Brodie.

When you're a sysadmin of several systems, you soon find yourself needing a centralized `dashboard' (ugh, I hate that term!) of sorts for your systems. That is, a central monitoring point where, with one or two screens, you can easily check on the overall health of ALL of your systems. And yeah, it helps when the same monitoring tool/suite notifies you 24x7 when something goes awry.

In this context, many product names are familiar: Nagios, Zenoss, Hyperic, OpenNMS, but one that I personally feel that gets overlooked too often is Xymon.

Anyhow, all of the above-mentioned products work well. Some are free, and some are mostly free unless you wish to purchase support or perhaps value add-ons. After trying most of them out, I settled on Xymon. Why? Because it's simple, lightweight, flexible, scalable, and yes, free. The others? They're all quite good, but I found them time-consuming to set up, and many of the screens display "too much" for my liking. There can indeed be "too much" of a good thing.

Historical note: Xymon is the current name of the project formerly known as Hobbit. Due to a nastygram the project lead got from the Tolkien estate some time ago, the project had to be renamed. You will notice however that portions of the original project name are still there (configuration file names, for example). So long as you know that Hobbit=Xymon, you'll be fine.

If you've never seen Xymon, you need to check out the online demo. I guarantee it will take you about 60 seconds (or less) to see how it works. Go to http://www.xymon.com. You'll see a simple screen with a few catagories and colored icons: green = good, yellow = warning, red = bad. The Xymon "home screen" is quite simple, and is one of the reasons I like this setup so much. Simplicity = elegance.

Navigating the display is simple. Start with the icon next to "systems." You'll see a few servers listed and lots of status icons. Click on ANY of the status icons for info. Click on a CPU icon. Once you've done that, scroll to the bottom. Check out the RRD historical graph at the bottom. And click on it. Whoa - lots of history and trend info. By the way, the online demo is actual live Xymon monitoring of a few servers belonging to the project's primary author.

After playing with the demo, you will either say "feh", or you'll say "whoa-- this is pretty powerful, yet - simple". For the latter folks: read on.

Setting up Xymon is simple. It's available as RPMs and source. I prefer source. Compiling it (follow the instructions) is straightforward. By the way, your distro may still use 'hobbit' as the package name. I'm not going to go into how to build and install Xymon, my goal is to describe a few of the key configuration files that make Xymon work. Note, as you read on, the simplicity of the setup. Xymon includes easy hooks into your local apache server.

The primary file that drives Xymon is bb-hosts (Why bb? Hobbit.. er.. Xymon is an active branch of the older, less capable "Big Brother" monitoring package). The bb-hosts contains the systems you want to monitor. The first entry is the Xymon host itself (and is required). The other two shown in the example below are two additional servers I want to monitor. (see bb-hosts(5)).

The basic format of this file is pretty straightforward: IP and host name. Other options are available as extra tests per host, such as checking web pages, verifying oracle is running, and so on. You can add the options later as you become familiar with how it all works.

# format is
# ip-address       hostname                # tag1 tag2 ...
192.168.1.10       xyhost                  # bbd apache=http://127.0.0.1/
192.168.1.1        system1
192.168.1.2        system2

Once you get rolling, you can eventually categorize and group the Xymon display page to your liking. For example, you can have all of your web servers in one sub-page and all database servers in another sub-page. You can mix and match, and hosts can occupy multiple sub-pages if you wish. It's all a simple matter of editing bb-hosts and following examples in there.

The next file that will become of great importance to you is hobbit-alerts.cfg. This file describes the notification actions to take when an event occurs.

SERVICE=conn
 MAIL my.email@my.domain RECOVERED FORMAT=TEXT

The entry above says, "Whenever ANY server is unreachable via a simple ping, send a detailed message to the email address listed". There's lots of flexibility here. You can have alerts sent when only certain servers fail, and ignore alerts for others. You can limit the times of day that alerts are actually sent, and so on. It's important to not have your Xymon environment "cry wolf" with too many false or chatty alerts, or everyone will start ignoring them. SMS texting is also available using out-of-band methods.

That's it! After setting up a hobbit server and configuring only a handful of simple text files, you now have basic monitoring. Without anything installed on clients, hobbit can remotely monitor things like uptime (ping test), http, ftp, ssh, smtp, and a few others. The power comes in when you install a little hobbit client on each server. Then, you'll have it all: CPU, memory, disk, processes (and more). You also have the ability to download/customize or even write your own tests. There's a ton of available modules you can add.

I highly recommend getting started slowly. After you have basic Xymon monitoring as outlined above, go ahead and build the client and install it on ONE of your additional servers above. Make sure to allow the xymon port (the default is tcp 1984) into the xymon server. When you check out the Xymon display, you will notice the server that has the client running will report a lot more information available for you to investigate.

When I set up a new server (we add stuff weekly), one of my configuration steps is adding it to the hobbit/xymon monitoring. On the Xymon server side, I add one text entry in the bb-hosts file. On the client side (the new server), I create a hobbit user account, grab the client tarball that I built earlier, and untar it in the hobbit user's home directory. With the final step of adding an init script, I'm done. Takes about a minute. The client is VERY lightweight, and gathers data using simple available tools like "top", "df", etc.

I like Xymon because it meets the "Gene Simmons" principle. It's simple, and it's effective. All of your sysadmin tools should be that way.

Kent can be reached at kbrodie at wi.rr.com if you have any questions.

Further reading:

December 16, 2009

Day 16 - Hudson: Build Server and More

Hudson is a job monitor. It is primarily used as a build server for doing continuous builds, testing, and other build engineering activities. Continuous build and integration is a useful tool in improving the day-to-day quality of your company's code.

My first week's impression of Hudson was that it is really great software. Things work the way I expect! It has good documentation and a good web interface. Additionally, the APIs are easy to use. Compared to other learning curves, Hudson's was extremely short thanks to one part documentation and one part ease of use. I was building some work-related software packages in hudson in only a few minutes of playing with the tool.

Setting up a new job in Hudson is really easy, and every field in the job configuration interface has a little question mark icon that reveals useful documentation when clicked, so it's not often you get lost. Functionally, it has the build-related features I expect: build on demand, build if there's been new commits, email folks who break builds, show reports on build histories, etc.

Getting a bit more advanced into Hudson beyond simply building stuff or running jobs, let's talk administrative tasks. Speaking of administrative tasks, Hudson has administrative documentation detailing how to backup and restore Hudson configurations, renaming jobs, etc. Hudson's configuration is stored in XML files in a sane directory heirarchy that makes it easy to backup specific jobs or specific configurations.

Hudson also has an API. The things you need to know about the API is that any url you visit on the web interface can be accessed with the API. Adding '/api/' to any url will give you the API documentation for that url - only one thing to remember when asking "what's the API for this page?" - totally awesome. Check out these screenshots of exactly that:

I wanted to take the latest successful build of a specific job and put the resulting files (artifacts) into my local yum repo. Artifacts are what Hudson calls the files you archive after a build is complete. Fetching the artifacts from the latest successful build of any given job is fairly straightforward from the web interface. The XML api makes this easy, allowing you to find the artifacts for your builds from scripts:

% GET http://build/hudson/job/helloworld/lastSuccessfulBuild/api/xml
<?xml version="1.0"?>
<freeStyleBuild>
  ...
  <artifact>
    <displayPath>rpmbuild/RPMS/x86_64/helloworld-1.0-1.x86_64.rpm</displayPath>
    <fileName>helloworld-1.0-1.x86_64.rpm</fileName>
    <relativePath>deploy/rpmbuild/RPMS/x86_64/helloworld-1.0-1.x86_64.rpm</relativePath>
  </artifact>
  ...
</freeStyleBuild>
Parsing XML in shell without the proper tools should make anyone a sad panda. Luckily, Hudson's XML api allows you to give an XPath query to restrict the output:
# Show me the text contents of the first artifact/relativePath
% GET 'http://build/hudson/job/helloworld/lastSuccessfulBuild/api/xml?xpath=//artifact[1]/relativePath/text()'
deploy/rpmbuild/RPMS/x86_64/helloworld-1.0-1.x86_64.rpm
That path is relative to the URL without the '/api/xml' part, so fetching the RPM becomes: http://build/hudson/job/helloworld/lastSuccessfulBuild/deploy/rpmbuild/RPMS...

Fetching the RPM was only the first step of a deployment process I was building with Hudson. At work, sometimes engineers do deployments. It is not totally productive to require them to have working knowledge of rpm, yum, mrepo, puppet, linux, ssh, and other tools that may be necessary. The deployment learning curve can be reduced to almost zero if we have a one-click deployment option that would do all the right things, in the right order. Having this would also save us from having to (poorly) maintain a wiki describing the steps required to perform an on-demand upgrade.

As shown above with the API, we can fetch the latest packages. Once that happens, the exact method of deployment is really up to you and what your infrastructure needs. My version pushed the rpm to my yum master, then replicated to the per-site mirrors, then ssh'd to each related server, upgraded the package, and restarted any service required. The benefits of this are two-fold: we retire a poorly maintained upgrade howto document, and we relieve some engineers of the burdens of being intimate with the infrastructure, so they can just worry about writing and testing code.

One small trick, however. Since Hudson has a 'build now' button, I didn't want stray clicks or accidents to incur a new deployment. The workaround was to add checkbox to the build that simply asked for confirmation. Without the checkbox checked, the build would fail.

Now armed with an automated, but still human-initiated, deployment process, your deployment job can be extended to include email notifications, nagios silences, and other actions that help make your deployment more safe and reliable.

While I am not certain that Hudson is the end-game of helping coworkers do deployments to production and staging, I am comfortable with this solution given that it works well, was very easy to implement, and relieves the knoweldge transfer problems mentioned above.

Even if you don't like Hudson for deployment, it's a great build server.

Further reading:

December 15, 2009

Day 15 - Replacing Init Scripts with Supervisord

I find it kind of tragic that System V (SysV) init (/etc/init.d, etc) has survived as long as it has. Looking at its features, it's a pretty plain system, so why is it still here? Maybe because, historically, it has been good enough. However, in the places it hasn't been good enough, folks made workarounds, extensions, and even efforts to vanquish it entirely.

Sometimes these workarounds and extensions are done improperly. SysV init often forces upon programs common tasks such as pid file management, daemonizing (backgrounding), log management, privilege separation, etc. Most things don't use pid files correctly (nobody locks them), many startup scripts lack a functioning 'status' check, and everyone reimplements the daemonizing and privilege dropping differently and many times incorrectly. Yuck, I want less of that.

Sometimes you also need more. What was cool in 1980 may not be cool today. Providing you more is a project called supervisord.

What more is needed? Automatic restarts, centralized control, common configuration, etc.

What if you need more? That's where supervisord comes in. Supervisord gets you a few more goodies you may find useful, including a management web interface, an API, including process startup backoff.

Installation is pretty simple and comes with a sample config generator for helping decrease the learning curve. Further, the config format looks like INI format, so the learning curve there should also be pretty short.

I decided to try putting mysql into supervisord for testing, so after creating the default config file:

# echo_supervisord_conf > /etc/supervisord.conf
I checked ps(1) for how I was running mysql, and put that invocation in supervisord.conf:
[program:mysqld]
command=/usr/sbin/mysqld --basedir=/usr --datadir=/var/lib/mysql --user=mysql --pid-file=/var/run/mysqld/mysqld.pid --skip-external-locking --port=3306 --socket=/var/run/mysqld/mysqld.sock
Then I ran supervisord (you probably want supervisord to to have an init script, so it launches on boot, etc)
% sudo supervisord

# it's running, so let's check on our mysql server:
snack(~) % sudo supervisorctl status       
mysqld                           RUNNING    pid 26028, uptime 0:00:28
Hurray! Supervisord even tries understanding what exit statuses mean. If I send SIGTERM to mysqld, then mysqld will shutdown gracefully and exit with status 0. By default, supervisord is configured that an exitcode of 0 is "expected" and thus it won't restart the process. You can change this by setting the 'autorestart' option to 'true' or by changing which exit codes supervisord understands as expected with the 'exitcodes' option:
[program:mysqld]
command=/usr/sbin/mysqld ...
autorestart=true
Supervisord can be told to reload (restarts itself) or to reread the config file. In this case, we can just tell it to reread the config file:
snack(~) % sudo supervisorctl reread 
mysqld: changed
Now any mysqld exit will be restarted automatically.

Additional features include the management web interface, which can be enabled in the config file with the [inet_http_server] configuration and also with the [unix_http_server] configuration for local-only management. The supervisorctl tool can talk to remote servers, so the http server portion isn't just for people.

Supervisord also seems easy to extend and supports event notifications if you need it. Supervisord also handles logging of stdout and stderr for you in a reasonably configurable way.

At time of writing, there are a few shortfalls.

  • No HTTPS support on the management interface
  • No decent per-program access control
  • No 'retry forever' option. startretries defaults to 3 and has no value for infinity. Perhaps setting a really huge value for startretries is a reasonable workaround. I tried startretries=100000000 which seems to work,

Supervisord may not replace all of your startup scripts, but I highly recommend it, or something like it, for your important services.

Further reading:

December 14, 2009

Day 14 - Inventory Management Tools

This article was written by Saint Aardvark the Carpeted

If you work in smaller environments, like I do, the need for inventory software can seem...well, distant. Maybe you can keep track of everything already, or maybe that spreadsheet or wiki page is just fine.

But what happens when you upgrade your systems? What about when you want to get more information, like service tags or the number of DIMM slots in use? What about keeping a history of each machine, so you can see what problems you've had with it? What about simply hitting the jackpot and getting ten or twenty or fifty machines in a week?

Relax. OCS Inventory NG and GLPI are here to help.

OCS Inventory NG

OCS Inventory NG is a French project released under the GPL. It helps you:

  • keep track of your systems, including a full inventory of software and hardware
  • manage the inventory using a web interface
  • deploy packages to your systems as needed

Now, I'll be honest: I don't use the package management part of OCSNG. (I use cfengine for that.) Instead, I use the agent software to get machines to inventory themselves.

The OCSNG agent a clever tool that runs well on both Unix (I've tested it on OpenBSD, CentOS and Ubuntu Linux, and Solaris) and Windows (I've only tried it on Windows XP so far). It takes an inventory of the hardware (including things like Dell service tags), number and type of hard drives, and MAC addresses, and reports it via the web interface.

(One gotcha: I tried for a while to get the web interface to work behind Apache's mod_reverse_proxy, but this failed. In the end I gave up and put the website on a server available directly from my networks.)

Because the agent is meant to be self-sufficient, it will automagically install the various Perl modules it needs if it can't find them and put them under its installation directory (/opt/OCSNG by default). I'd rather grab those modules using the distro's package management tool, so I wish there was a way to turn that behaviour off. However, that's a minor nit.

You'll notice that the management website is kind of spare. This is where GLPI shines.

GLPI

GLPI is another French, GPL'd tool, and it complements OCS Inventory quite well. It has a much broader aim: rather than simply keeping track of your machines, it allows you to keep a whole swath of information about them. Problems and their resolution, support contracts, contact people, random notes -- GLPI wil track it all.

Again, though, I already have tools for much of this (Request Tracker for tickets, FosWiki for documentation). What I really like about GLPI are the inventory tools.

GLPI will certainly let you add new machines manually to its inventory. There is a plugin for GLPI called OCS Import that will let you suck data in from your OCSNG installation, and that's what I've done.

Installing the OCS Import plugin is simple, but adding new machines takes a bit more work. Rather than automagically grabbing info from OCSNG whenever it shows up, the plugin allows you to specify machines to insert into GLPI, or to update afterward.

(Originally, I was going to write that it was a shame that you had to do this by hand, not just the first time, but every time the information in OCSNG got updated. However, it turns out there is a script in the plugin to do a mass synchronization of GLPI with OCSNG and is suitable for running from cron. Memo to myself: RTFM.)

GLPI's interface is easy to use. You can update location information, add PDFs of support contracts, or change the responsible person. You can export inventory lists to PDF. Additionally, you can extend its functionality with a multitude of plugins, covering everything from order management to exporting notes to Outlook to showing Snort alerts.

You've tried chocolate and peanut butter; now try OCS Inventory NG and GLPI. You'll like it.

Further reading: